 PREVIOUS topic Biogeographic data |
Mapping distributions |
 NEXT topic Entering data |
 PREVIOUS topic Biogeographic data |
Mapping distributions |
 NEXT topic Entering data |
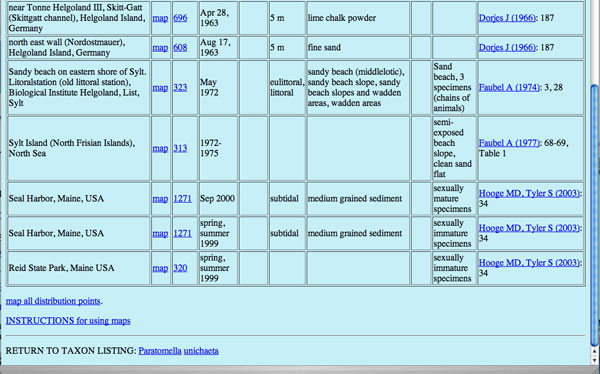
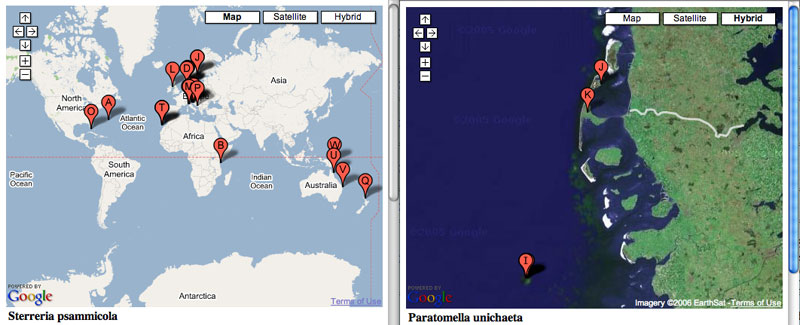
Species distributions can be displayed on two kinds of maps, one of individual sites and one showing all sites together. Individual site maps are reached from the links in the "map" column in the distributions lists, while all sites together are mapped with the link at the bottom of the distribution tables ("map all distribution points"):

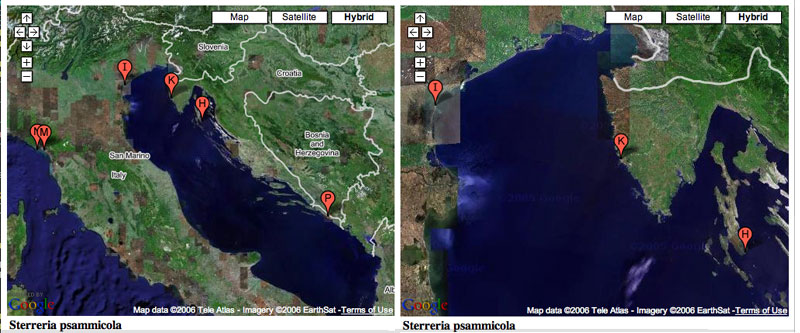
Both types of maps are interactive in that their views can be zoomed in or out and panned. Individual-site maps are generated through the Discover Life Web site by Topozone.com.


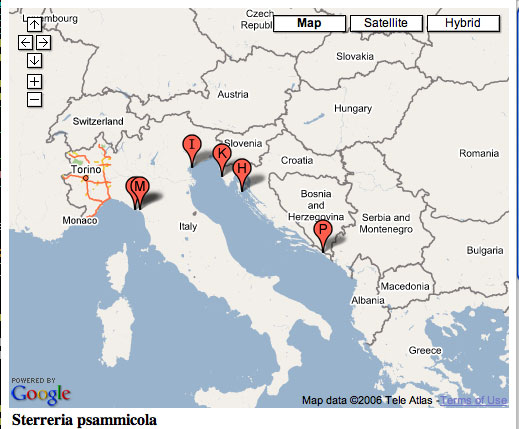
Maps of all distribution points for a species are drawn with Google Maps (http:local.google.com) and have the advantage of on-the-fly panning and zooming as well as of choice of type of display, whether conventional maps or satellite images or a combination of both ('hybrid').


 PREVIOUS topic Biogeographic data |
Introduction |  NEXT topic Entering data |